|
Grain Size Measurement
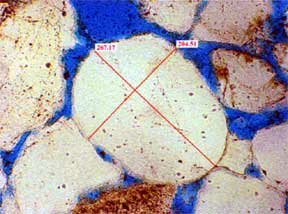
Image from the Dakota Group, "J" Sandstone, Denver Basin, showing sample grain size measurements (length, 267.17 µ and width, 204.51 µ) of a single quartz grain (units are in microns (1 mm. - 1,000 microns)).
Integrating thin section petrography with porosity and permeability data derived from core analysis has always been a challenge. That's why our new petrographic reservoir characterization capabilities should be part of your exploration and production planning.
Interactively Selected Pores
Sample image from Dakota Group, "J" Sandstone, in Denver Basin, showing intergranular pores (outlined in red) (labels are area of pore in microns squared (1 sq. mm. = 1,000,000 microns sq.)).
Many other types of measurements and statistics can be gathered and analyzed, providing a quantitative link between core analysis data and thin section descriptions. Let us show you how petrographic reservoir characterization can calibrate your exploration and development projects back to the rocks.
Pseudo mercury injection capillary pressure curve, plotting cumulative porosity against cumulative pore area, used to compare reservoir quality of a set of Mesaverde Group sandstones.
|
Petrographic Reservoir Characterization
Petrographic reservoir characterization provides a clear link between reservoir engineering data and geologic reservoir characterization based on logs and seismic data. Using the same type of software used on scanning electron microscopes with conventional petrographic microscopes allows precise calibration of photomicrographs and permits measurement of grains and pores with micron or sub-micron accuracy. Measurement of large samples of grains and pores allows:
- Determination of grain and pore size frequency distributions
- Measurement of percentages of intergranular and moldic pores
- Analyses of total pore area vs pore size
- Discrimination of sedimentary facies based on quantitative data
The two graphs show some of these applications. In the top graph, pore area per size class is shown with cumulative pore area and cumulative percent pore area. Pore ECD (equiv. Circ. diam.) provides a link between this graph and the bottom graph. In it, pore and grain size frequency, and cumulative percent) are combined. Pores less than about 70 microns in size are intergranular. Large pores are mostly moldic. In the upper graph, pores less than 70 microns are equal to about 40% of the porosity.
Total pore area frequency distribution by class size, with cumulative pore are, cumulative % pore area and pore ECD (equivalent circular diameter), Dakota Gp., "J" Ss., 5137 ft., Denver Basin.
Frequency distribution (by size class, cumulative, and cumulative %) for grain size and pore ECD (equivalent circular diameter). Porosity is dominantly intergranular but with some moldic pores (compare with area, above), Dakota Gp., :J: Ss., 5137, Denver Basin.
|